I spent some time analyzing all of my sleep tracking data from the past year collected using my Ōura ring. In the following chart, each stacked bar represents one day of sleep data (deep sleep in green, light sleep in blue, REM sleep in yellow) as well as time awake (in red – can you spot the two days I was sick in bed?).

While their app does a nice job of presenting summary data, Ōura provides their own web-based tool called Ōura Cloud that allows you to view your trends and generate some charts. However, the functionality is somewhat limited in terms of doing a deeper analysis. Fortunately, they allow users to export their raw data from Ōura Cloud or via their developer API (which still requires an understanding of JSON file formats and some coding and/or Excel skills). I imported the data into my personal database so I could easily query the data needed. For example, this query returns sleep summary data for every day in 2019:
Query:
SELECT sleep_date,
ROUND(deep_secs/60::decimal,2) as deep_mins,
ROUND(light_secs/60::decimal,2) as light_mins,
ROUND(rem_secs/60::decimal,2) as rem_mins,
ROUND(awake_secs/60::decimal,2) as awake_mins,
ROUND(tot_in_bed_secs/60::decimal,2) as tot_in_bed_mins,
ROUND(tot_asleep_secs/3600::decimal,2) as tot_asleep_hrs
FROM sleep
  WHERE (sleep_date >= '2019-01-01'
    AND sleep_date <= '2019-12-31'
    AND is_main = TRUE AND status = 'A')
ORDER BY sleep_date;
Result:
 sleep_date | deep_mins | light_mins | rem_mins | awake_mins | tot_in_bed_mins | tot_asleep_hrs
------------+-----------+------------+----------+------------+-----------------+----------------
 2019-01-01 |     58.00 |     339.00 |    44.00 |     124.00 |          565.00 |           7.35
 2019-01-02 |      8.00 |     285.50 |    15.00 |     138.50 |          447.00 |           5.14
   ...            ...          ...        ...          ...              ...              ...
I could then generate charts from this data.
Overall Sleep Averages for Year
There were 336 nights over the past year where I tracked my sleep (92% of all nights). The missing nights of sleep data were due to either forgetting to wear the ring (left it on the charger) or forgetting my charger while traveling and the battery eventually draining.
| Count | Deep (mins) | Light (mins) | REM (mins) | Awake (mins) | Total Sleep (hrs) | |
| 336 | 56.30 | 272.46 | 48.57 | 105.88 | 6.29 |
However, this data isn’t entirely accurate because after going through my sleep details for each night, I had to eliminate approximately 30 nights of data where I noticed some overnight data was missing.
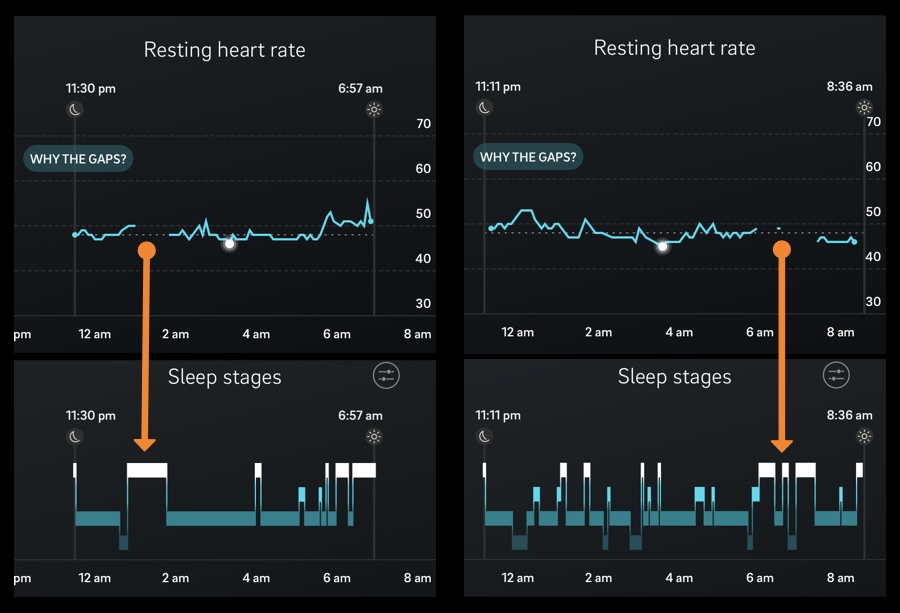
There are a number of ways these sleep data gaps can occur, such as:
- Ring is too loose, causing it to rotate around finger so the sensors (located on the bottom of the ring) are unable to accurately track sleep
- Sensors are dirty
- Battery died overnight (forgot to charge!)
- Arm fell asleep, cutting off circulation to finger
- Exceptionally low heart rate (below 33 bpm)
Here are my adjusted totals (based on 303 nights / 83% of the year), which actually turn out to be fairly similar:
| Count | Deep (mins) | Light (mins) | REM (mins) | Awake (mins) | Total Sleep (hrs) | |
| 303 | 55.79 | 274.42 | 48.95 | 106.94 | 6.32 |
Average Sleep by Day of Week
I could then dig a little deeper into my data to look for any obvious trends. The scatter plot below shows a distribution of my total sleep (deep + light + REM) for each day of the week, along with each daily average total sleep (thanks to my Awesome Labs co-founder Jeremy for helping with this chart!):

And here are my averages by day of week:
| Day | Count | Deep (mins) | Light (mins) | REM (mins) | Awake (mins) | Total Sleep (hrs) |
| Sun | 42 | 60.45 | 270.77 | 49.24 | 111.11 | 6.34 |
| Mon | 42 | 64.17 | 253.11 | 47.96 | 106.12 | 6.09 |
| Tue | 48 | 55.55 | 272.83 | 45.33 | 104.70 | 6.23 |
| Wed | 44 | 53.61 | 285.98 | 50.74 | 108.76 | 6.51 |
| Thu | 45 | 59.20 | 272.92 | 47.09 | 102.50 | 6.32 |
| Fri | 41 | 47.78 | 276.11 | 51.41 | 103.67 | 6.26 |
| Sat | 41 | 49.33 | 289.41 | 51.54 | 112.35 | 6.50 |
| Overall | 303 | 55.79 (11.5%) | 274.42 (56.4%) | 48.95 (10.1%) | 106.94 (22.0%) | 6.32 |
For the year, I averaged 6.32 hours of sleep per night, ranging from a low of 6.09 hours on Mondays to a high of 6.51 hours on Wednesday. While fairly consistent, I would like to maintain 7-8 hours of sleep per night (not including awake time). My relative sleep percentages were:
- Deep Sleep: 11.5%
- Light Sleep: 56.4%
- REM Sleep: 10.1%
- Awake: 22.0%
What Are Ideal Sleep Stage Percentages?
Surprisingly, I have yet to find consensus recommendations regarding “ideal” sleep stage percentages. Most of the data simply reflects population averages which even vary by age. For example, here’s what Fitbit has to say:

And here are sleep averages Ōura has posted:

Based on these guidelines, I seem to be lacking somewhat in REM sleep, which can be offset by eliminating overnight disruptions.
Average Sleep by Month
Next, I created a scatter plot organizing my total sleep by month:

Here are average breakdowns of each sleep stage:
| Month | Count | Deep (mins) | Light (mins) | REM (mins) | Awake (mins) | Total Sleep (hrs) |
| Jan | 27 | 42.54 | 302.61 | 70.85 | 96.37 | 6.93 |
| Feb | 26 | 50.77 | 303.48 | 73.00 | 94.02 | 7.12 |
| Mar | 27 | 46.22 | 310.28 | 67.13 | 78.00 | 7.06 |
| Apr | 26 | 44.08 | 299.58 | 54.42 | 87.00 | 6.63 |
| May | 29 | 67.09 | 272.33 | 41.86 | 115.66 | 6.35 |
| Jun | 27 | 61.85 | 257.37 | 38.30 | 117.85 | 5.96 |
| Jul | 25 | 62.24 | 255.42 | 33.66 | 111.20 | 5.86 |
| Aug | 29 | 47.14 | 266.05 | 32.48 | 124.22 | 5.76 |
| Sep | 22 | 66.30 | 233.30 | 37.07 | 111.48 | 5.61 |
| Oct | 22 | 67.07 | 256.82 | 32.75 | 105.55 | 5.94 |
| Nov | 23 | 67.00 | 258.33 | 49.04 | 109.02 | 6.24 |
| Dec | 20 | 51.45 | 262.55 | 54.85 | 139.45 | 6.15 |
Sleep Seasonality
There definitely appears to be some seasonality to my sleep totals, but surprisingly I sleep more in the winter. This seems to conflict with my seasonal overnight heart rate variability data trends, where I tend to see my highest HRV numbers in the summer.
It’s interesting to see that I get more REM sleep in colder months (I typically leave the heat off in my bedroom), and get more deep sleep in the warmer months. This seems to correlate with my body temperature throughout the year:

Time Zones and Travel
Something to pay attention to when analyzing sleep data are travel dates across time zones. Ōura stores sleep times in UTC format along with a single timezone offset (instead of offsets for both sleep time and awake time), so there is an edge case where sleep start or end times be wrong if you fell asleep in one time zone and woke up in another (your sleep totals would be correct but your sleep times would be shifted to whichever time zone you were in when syncing your data to your phone, since it would adjust its time to the local time zone). Fortunately, none of my sleep data was affected by this use case.
Accuracy of Wearable Sleep Trackers
I am still not convinced any wrist or finger-worn sleep tracking wearable is going to provide more than 70% accuracy in sleep stage detection (going from deep sleep to light sleep, or light sleep to REM sleep). Not because these devices are “bad” (their algorithms are getting better), but as I explained earlier many (user-related) factors can affect the data. That being said, I feel the most important metrics to monitor are consistent total sleep duration and minimizing sleep disruptions (maintaining a consistent bedtime can be helpful as well).
If you are like me and want a second (or third!) opinion as a way to audit your sleep data, you can always throw on another device from companies like Biostrap and Fitbit and compare your sleep data.
Summary and Next Steps
I am planning a much larger self quantification experiment where I conduct a through sleep study correlating my sleep data with numerous other variables – for example, how do things like exercise, alcohol, meals (and meal timing) affect my sleep numbers? Do specific activities like meditation, reading, or playing an instrument affect REM function that evening? What about bedroom temperature, air quality, cold showers before bed, mouth taping, etc.? Stay tuned!
Resources
Ōura Ring (save $50!)

 With a Pulse Oximeter")